Fans and experts alike use stats constantly to assign value to performances, some of which capture deeper and more nuanced aspects of the match than others, but can they ever tell the full story?
The recently completed men’s Ashes series (which finished 2-2) was as compelling a narrative as it was a brilliant spectacle of the sport's longest form. There were countless micro- and macro-narratives in each Test, on each day, and in each session of play. Some of which are hard to forget, others of which will be resigned to the memories of the few that were actually there as there was just too much going on for a normal human brain to remember it all.
Looking back at the series in its afterglow, it feels like one great big blur of drama - brilliant, riveting, amazing drama with countless numbers pouring out of it to help us recall it all and understand it better.
When it comes to batting in cricket, the numbers that we tend to lean on, the ones we use to rate players against each other are: runs scored, batting average, strike rate (especially in limited overs cricket), and milestones like centuries (that is, scoring 100).
These are the things we tend to point to when we assess the performances of batters. Who scored the most runs? What did they average throughout the series?
Two players stick out in the recent Ashes series when you glance at those aforementioned key batting metrics - Australia’s Usman Khawaja and England’s Zak Crawley.
Both of them are openers who sit atop the runs chart for the series and, funnily enough, each of them scored in totally opposite ways, stylistically speaking. In fact, maybe as opposite as you can get. Their respective strike rates (Khawaja: 39.27 and Crawley: 88.72) demonstrate this clearly.
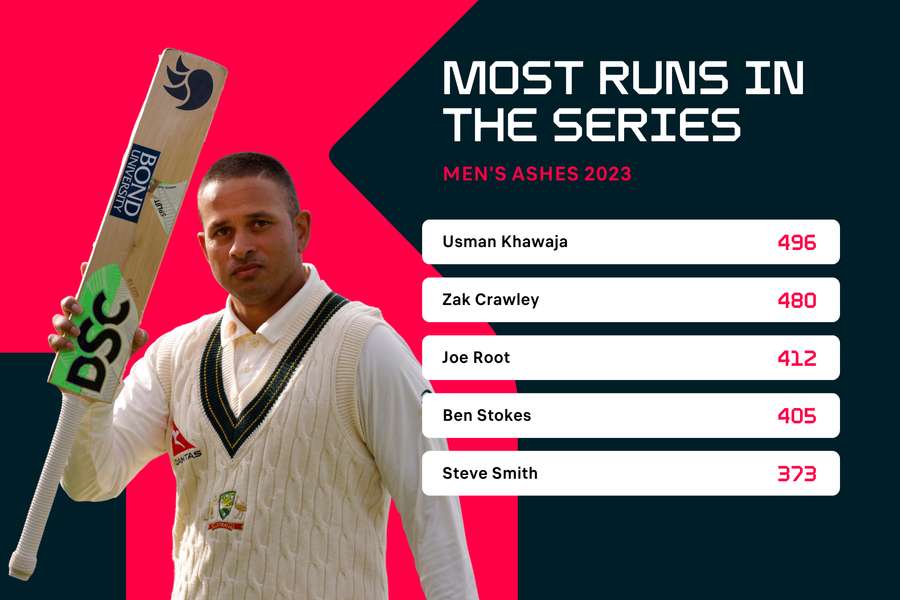
When we look back with misty memories at the 2023 Ashes in the deeper future, we will see those raw numbers and might think to ourselves: They were the two best batters in the series. However, those numbers only tell part of the greater story.
What we can’t gather instantly from these stats is just how impactful their contributions were in the context of the innings in which they were played.
We might forget Khawaja’s one-man stands in both of his crucial knocks in the first Test at Edgbaston - how he defiantly blocked or belied balls, seemingly, for an eternity to keep Australia afloat in the match.
We might also forget the sheer ruthlessness of Crawley’s swashbuckling 189 in the unfortunately rain-affected drawn fourth Test in Manchester - how that innings effectively set up what looked to be a certain win for the hosts only for the weather to sweep in and render it a little less momentous.
We know from glancing at the scorecards that they each played impressive roles in both of those matches but how can we show that numerically? What if we wanted to quantify the relative impact of a player's runs to show how much their innings stood out against their peers in the context of a match?
There are analytical systems floating around that attempt to do just this - most famously, Impact Index. Impact Index - with its sister stats of Impact Runs and Impact Wickets - seeks to quantify the impact a player has relative to the performances of the other 21 players in a particular match.
Impact Index emerged over a decade ago and now appears on websites such as ESPNCricinfo - mainly in the context of Twenty20 cricket. However, Impact stats haven’t really stuck in the collective cricketing consciousness or made their way into the common parlance of the game. Suffice it to say, they haven't had their expected impact - at least, not yet anyway.
Perhaps that is because Impact stats stand behind a rather opaque wall - the guarded algorithms used to generate the numbers. Understandably, it’s protected intellectual property but I wonder if that inability for lay people to plug the stats into the game for themselves and properly understand them has hindered their chances of truly taking off as a popular tool.
In what follows, I will present another approach for looking at the relative impact of batters in a less complex and, hopefully, intuitive way. It is a system that seeks to compare the performances of batters, not to all the other players in the match but just those they shared a specific innings with.
A new stat: Relative runs
Take the total runs a team scores in an innings and minus the extras - that is, take just the runs scored by batters. Divide that total by the number of batters that appeared in that innings and you get essentially a par score for a batter in that team against that particular bowling attack and in those particular conditions.
For example, going back to the Ashes, let’s take Australia’s first innings in the first Test (the second innings of the match). They scored 386 with 26 extras and all 11 players batted. So, the par score for that innings, as described above, is 360 divided by 11, which is: 32.7.
Next, take a particular batter’s score from that innings and subtract the par from it and you have a numerical representation of how they over- or under-performed in comparison to the mean score of their teammates. Let’s call this their 'relative runs' (RR) for the innings.
To illustrate, Khawaja top-scored in that innings with 141 runs, which means his RR score was 108.3. His opening partner, David Warner, however, only scored nine runs and so his RR score was -23.7.
If the batters had shared the runs between them more evenly, the RR scores of each would be closer. In this case, Khawaja was far and away the most effective better for Australia in the innings and that is reflected in his RR score being much higher than the next best of the innings, which was the 33.3 RR scored by Alex Carey (actual runs: 66).
You might be thinking: Hang on, don't the runs scored by a player already do the job of demonstrating their relative worth to the team?
Analysing a scorecard, in a way, yes, they do. You can glean this information but this metric allows us to show the difference between scoring 141 when the next-best total is less than half of that versus scoring 141 in an innings in which it isn’t the top score and much closer to the par performance of the other batters.
Greatly outperforming one’s peers is a sign of an instrumental innings and this metric simply helps us quantify that notion.
Crawley’s 189 was not only the top individual score in the series, but it was also the top RR score. In that innings in Manchester, England’s par score was 50.6, meaning Crawley’s RR score for the innings was 138.4. The next highest RR score in a single innings was by England's captain Ben Stokes, when he scored an almost-match-winning 155 at Lord’s in the second Test (RR: 126.8).
In short, not all centuries are the same and not all runs are the same. Relative runs are a novel way of showing the value of a player's contribution in a simple, quantitive manner.
Just as we applied this to Australia’s first innings of the first Test, we can apply this system to each innings in all five Tests and combine the RR scores that players compiled throughout the series to show who most outperformed their peers.
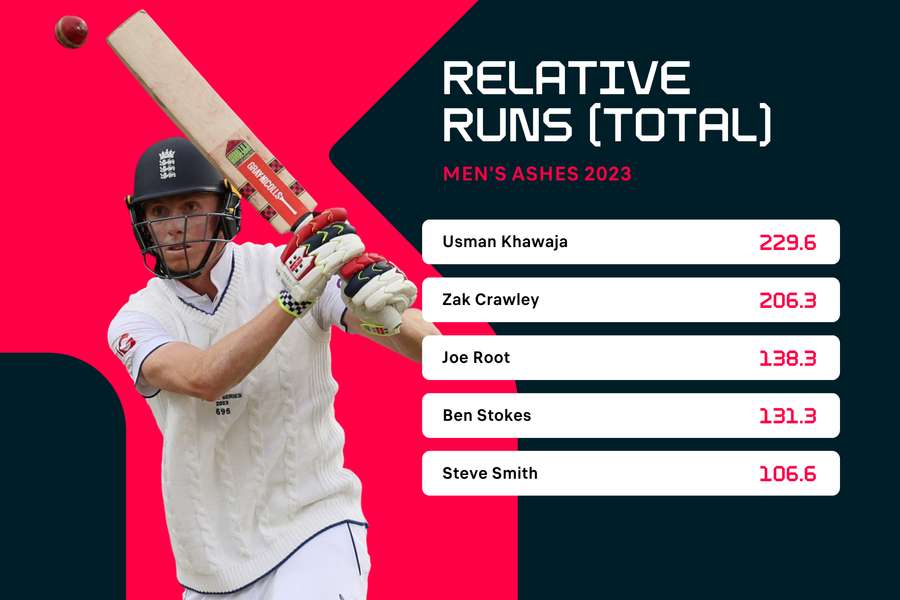
Applying this to the whole Ashes series, it turns out that the top of the table of RR scorers is, unsurprisingly, similar to the table of total run scorers. This is unremarkable as it follows intuitively that the players who scored the most runs are probably also the players who outscored their teammates most along the way.
Don’t forget Mitchell Marsh!
At first glance, it might seem that the top RR scorers are just the top run scorers and so the questions arise: Do we need this metric? What does it do that our other stats don’t do already?
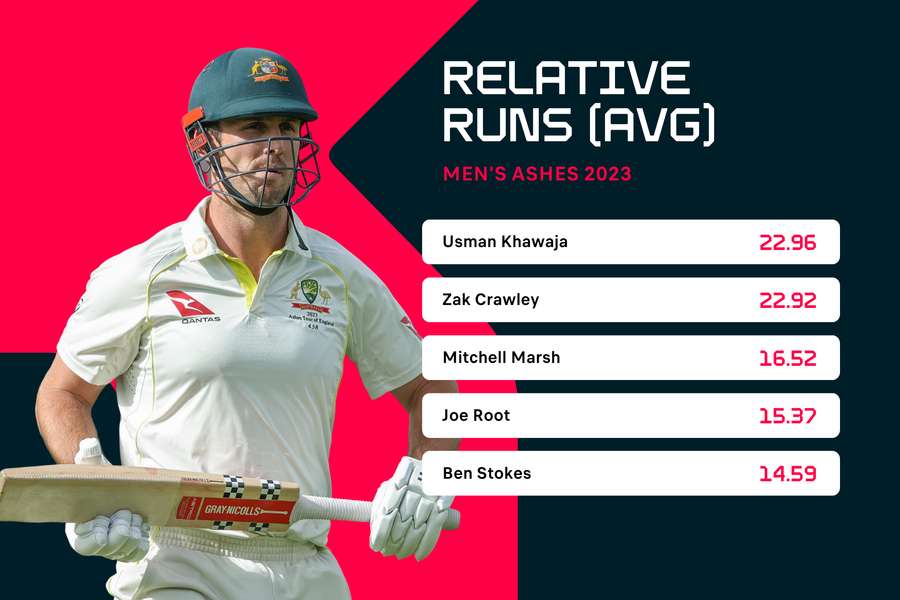
Well, when we divide the RR of a player by the number of innings they batted, we get a new and more pertinent stat - RR per innings. This stat tells a more interesting story over a series and it helps us highlight players who had fewer opportunities to contribute but who, when they did play, outperformed the mean considerably.
In the case of the Ashes, it helps us to statistically highlight a player like Mitchell Marsh. Marsh came into the Australian side in the third Test at Headingley to replace the injured allrounder Cameron Green and played one of the stand-out innings of the series - a run-a-ball century in a single session - much to the surprise of almost everyone.
Marsh was undroppable from that match on and played quite well throughout the remainder of the series. Due to the fact that he only played three matches out of five, he doesn’t figure near the top of the typical key performance charts for batters, though, aside from his outstanding average of 50 for the series.
His total RR for the series was 99.1 - less than Steve Smith (106.6) but greater than Travis Head (95.6) and Marnus Labuschagne (61.6). Importantly, he generated his RR over four fewer innings than those teammates.
Crucially, his RR per innings lifts him into the top three batters of the series according to that metric - a nice numerical reward for his performances.
A better example?
The power of RR comes out in matches that aren’t so evenly fought, I believe. Simply because the Ashes was contested between two of the best sides in the world, it was extremely close - in fact, it was one of the closest series between the sides in memory.
Due to the parity between the teams across all five matches, the par scores across innings of both sides were pretty similar throughout. Of the 19 innings batted by both sides, every par score was between 19 and 39 bar one - the innings in which Crawley scored 189 and England tallied an immense 592 runs.
Aside from that effort, most of the scoring was within a pretty similar range albeit at different rates, meaning the illustrative effect of a stat like RR was dampened as there weren’t many dramatic highs and lows, scoring-wise.
However, looking at another recent series - India’s two-match Test series against the West Indies - we can show how this instrument can provide more interesting, or rather, less obvious insights.
1-0 might not sound like a big defeat but the series was extremely lopsided. India obliterated their far inferior opponents, despite the series being held in the West Indies. India won the first Test by an innings and 141 runs and would have likely won the second Test comfortably, too, if it weren’t for a washed-out fifth day.
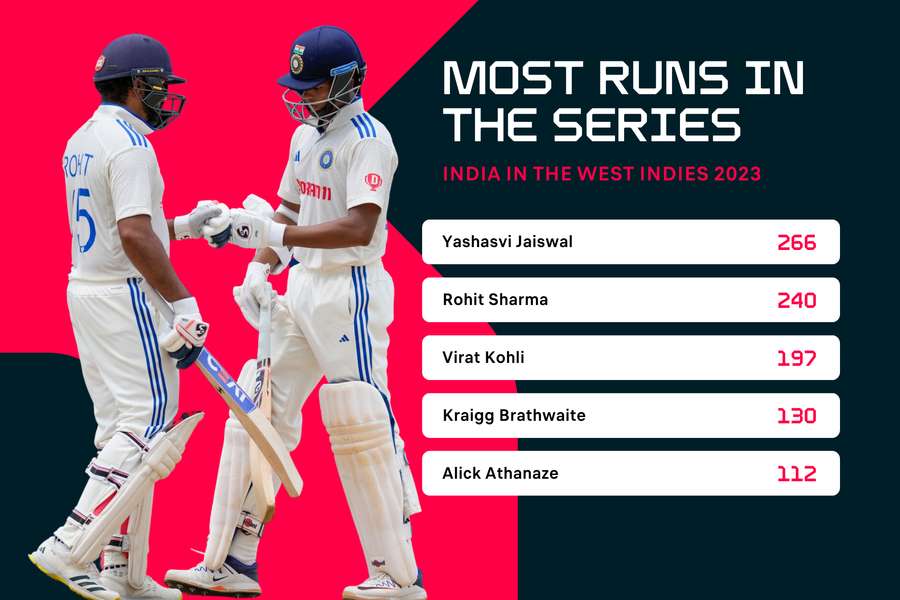
The top three scorers in the series were all Indian - Yashavsi Jaiswal, Rohit Sharma and Virat Kohli. After a cursory look at the scorecards, you would be forgiven for thinking there were no standout performers with the bat for the hosts across the two matches - captain Kraigg Brathwaite scored their only 50+ score (75 in the first Test). However, that’s not really the case and RR can help us highlight further value.
In the first Test, Dominican debutant Alick Athanaze scored 75 runs across his two innings for the West Indies. Kohli, in the same match, scored 76 in his one appearance at the crease. Kohli scored more runs in the match but it turns out that Athanaze scored more RR, as his team did so poorly overall, and that he averaged more RR across his two innings.
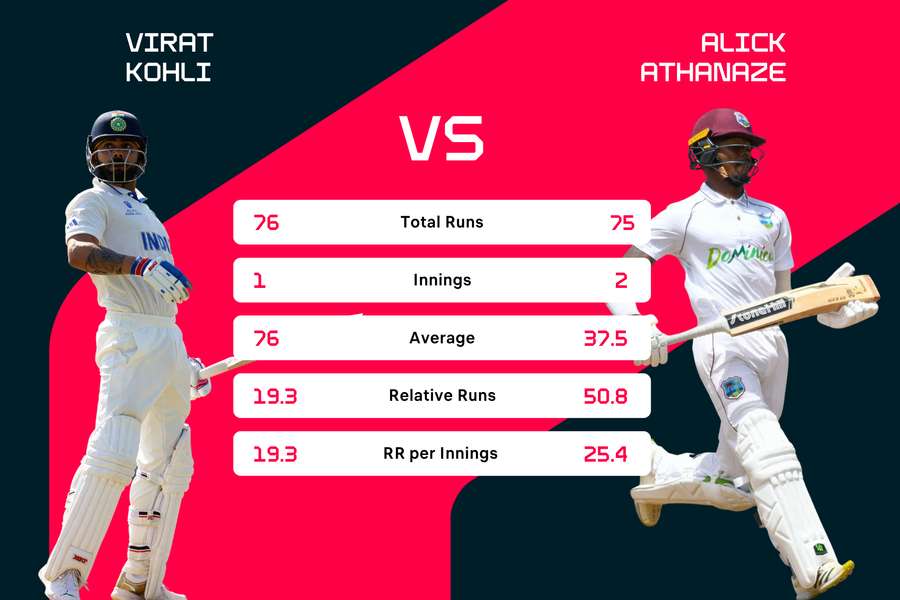
What does this mean? Is Athanaze a better batter than Kohli? Almost definitely not but he, and not Kohli, had to face the best two-pronged spin attack in the world and also batted with worse partners throughout his two innings.
Athanaze's relative bettering of Kohli is a neat numerical way to show that he’s a very promising player who did an admirable job amongst a truly shambolic team display in that Test.
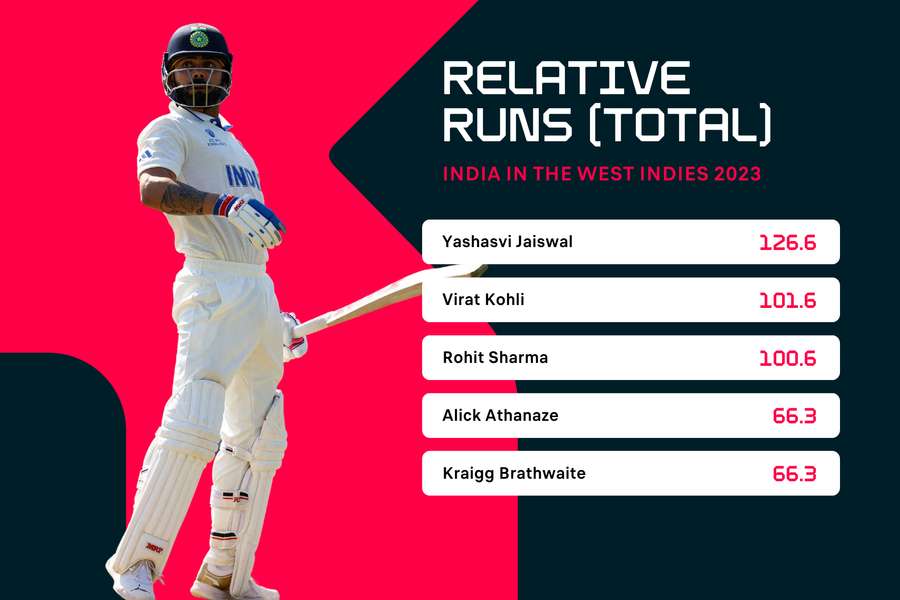
Across the two-match series, Athanaze still ended up scoring less than the best three Indian batsmen in terms of RR but he was the equal-highest contributor of his team in this metric as well as second behind Brathwaite in terms of total runs scored.
With a top score of 47 and a batting average that was a tick over 37, it would be easy to look at Athanaze’s debut series record and think: Not bad but unremarkable.
However, he was, at least relatively speaking, the best batter on his side with the most RR per innings. That’s something to hang onto and a nice example of what RR can do. Remember the name - Athanaze!
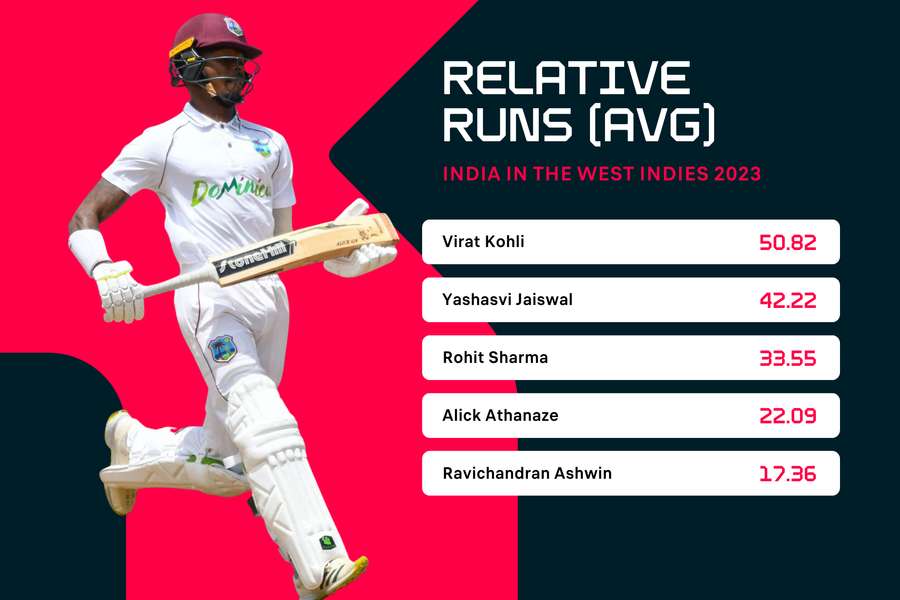
Kohli sits atop the RR per innings chart for the series despite scoring fewer runs than Jaiswal and Sharma. This is an interesting finding, indicating that he was more impactful on average than the other leading scorers. It should be noted, though, that he did bat one fewer time than them. Really, all three were very impressive and Jaiswal was particularly eye-catching, hitting 171 in his first Test innings - another one to watch.
A further interesting result of this statistical system is to temper the effect of inflated batting averages due to not outs. To illustrate, Ravindra Jadeja was the sixth-highest run scorer in the series with 98 runs from two innings but with just one dismissal, meaning he ended the series with a colossal ‘average’ of 98 having only notched a top score of 61.
This is just the consequence of a small sample size coupled with the way batting averages are calculated in cricket but it is, nonetheless, a little misleading.
Jadeja’s RR for the series, however, were just 2.6 and his RR per innings only 1.3. This puts into context just how less important he was to his team than Athanaze was to his, for example. Here, RR helps us show their relative impact in a way that other stats just can’t and, as in the case of batting averages, might actually tell the wrong story.
There are limitations to it, of course. By its very nature, RR favours outperformance over weight of runs and so certain innings will generate low RR scores if they exist in the context of multiple strong performances.
For example, Ishan Kishan's explosive half-century (52 off 34 balls) in India's second innings of the second Test scored him only eight RR because the par score was very high (44). What's more, Ravichandran Ashwin makes it into the RR-per-innings top five for the series rather anomalously, partly because he only batted once - another small-sample-size issue.
The results of RR, however, are interesting and the core principles could be easily applied to other forms of cricket - that is, T20s and 50-over matches - and indeed to bowling stats as well. A bowler’s relative economy rate springs to mind immediately as a useful metric. There are plenty of other applications that could branch off the foundational system discussed above, too, but that’s for another time!
Cricket is full of stats and here’s yet another one to indulge in. Hopefully, it goes some way to telling more of the story than the numbers did before. Alas, nothing tells the whole story like the match itself but that’s also why it is so beautiful after all.

